Where and when is it going to snow? For many the big question when they visit this site. But how do you get to such a forecast? How do you say anything about tomorrow’s weather, let alone next week’s weather? In this article I would like to briefly discuss the modeling of the weather.
There are many different weather models, but in essence they all work the same: Each weather model divides the atmosphere into smaller volumes. For any volume, or grid cell, we assume that the atmosphere here is the same. Figure 1 shows this schematically. Incidentally, these do not necessarily have to be squares. For example, the German ICON model has a triangular structure, while the MPAS model has a hexagonal grid.
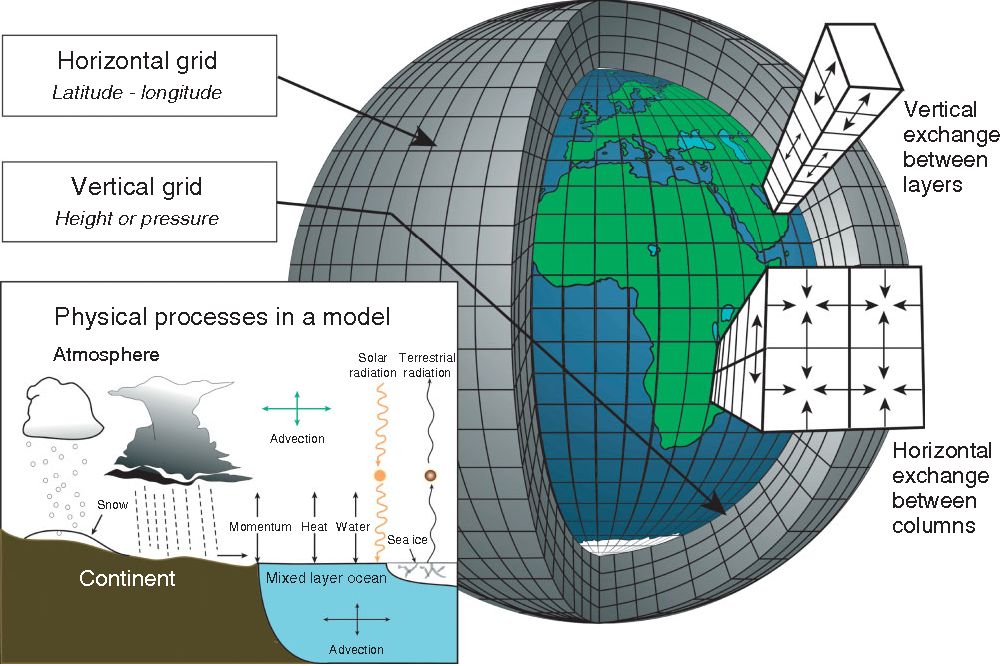
We can then solve a number of formulas for each of these volumes or grid cells that the atmosphere must meet according to physics. The so-called “governing equations” are a number of formulas that describe the conservation of momentum, mass and energy. These equations describe the movement of the sky over the earth. You can imagine, for example, that everything that flows into such a cube in figure 1 at a certain time must be compensated by what flows out at the other sides, or the density and pressure must increase.
Especially the equations for the conservation of momentum, the so-called Navier-Stokes equations, are very difficult for computers (and people) to solve. As a result, we need the most powerful supercomputers in the world to run these types of models. Fortunately, computers have become much faster in recent decades, which has contributed to the improvement of the weather prediction.
This also ensures that we can count on increasingly higher resolutions - in simple words: Dividing the Earth into more, and smaller squares. This is especially advantageous in the mountains. It is important to realize that the higher the resolution, the better you can depict the underlying topography (the terrain) (see figure 2). And thus, all interactions of the sky with this topography can be better simulated. In figure 2 you see a domain of about 40 by 40 km around Davos, CH for increasing resolutions of 2.2km (L), 1.1km (middle), 250m ®. Below: The section along the orange plane.

And there are many. Consider, for example, the influence that mountains have on the wind, but also the cooling down because air is forced to rise. These processes have a major impact on where the snow falls.
To calculate the weather at a high resolution for the entire world is still a bit too much for the current generation of supercomputers. Moreover, it is not necessary to calculate the weather over large areas of ocean in great detail. We can therefore distinguish between global models (GFS, ECMWF, ICON) and regional models (COSMO, ARPEGE, AROME). Global models run at a lower resolution, allowing them to quickly calculate larger areas. Subsequently, the prediction of such a global model for a select area (for example Europe) is calculated again at high resolution by a regional model. Typical resolutions of a global model are 13-28 km (ICON-GFS), while regional models operate on a scale of 1-7 km.
In practical terms, this means that if you want to know if there is more snow in the forecast for Andermatt or Engelberg, GFS may not be the best solution. It is better to look at a high-resolution model such as COSMO-1 from the Swiss weather service, or of course the WePowder model.
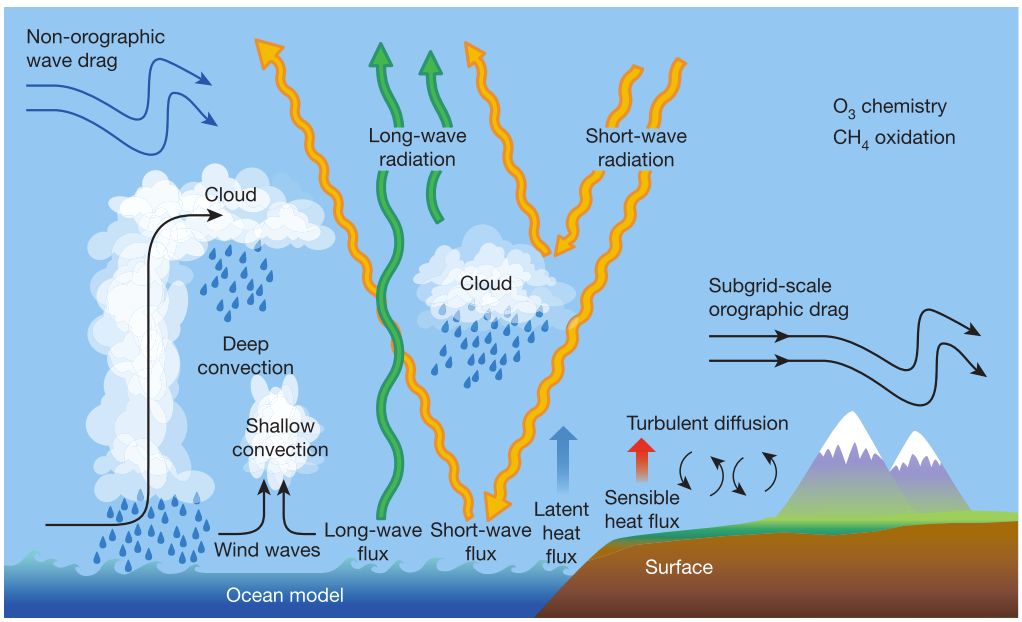
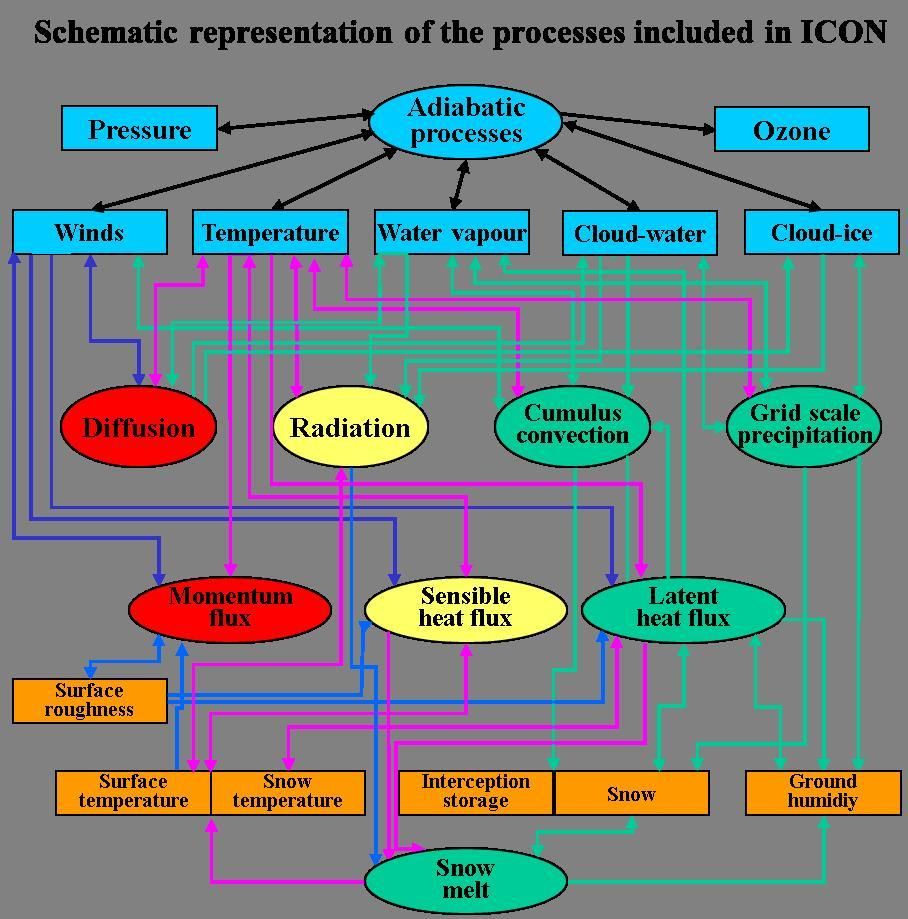
Has everything then been said? No by far. The above only describes the dynamics of a model: how the atmosphere moves. Then there are many, many steps in which the saturation of the air and the different types of precipitation are calculated (the so-called microphysics module), a module that calculates the short and long wave radiation, a module that determines the interaction with the land surface (snow !!) and much more. All these modules communicate with each other in order to arrive at a physically consistent prediction. See figure 3 for an overview of these physical processes, and figure 4 for a schematic representation of these processes in the ICON model. To describe all these steps I need many more articles, so that will have to wait until another time.
Sources
- Figure 1: Edwards, P… “History of climate modeling.” Wiley Interdisciplinary Reviews: Climate Change 2 (2011): 128-139
- Figure 2: Bert Kruyt/SLF
- Figure 3: Bauer et al 2015
- Figure 4: Deutsche Wetterdienst
Replies
Hey terrific article! I’m in the Dolomites at the moment and blown away, (bad pun) by the 18 MILLION trees felled but the VAIA in October 2018. Historical records show this weather phenomenon occurs about every 250 years. Winds were hurricane force and the storm lasted about 2 hours.
Would love to know how such a storm occurs if you get chance, it’s devastating what it did to the countryside, photos on the internet are jaw-dropping…Thanks