In my weather reports, I often use the ensemble forecasts of both the GFS and ECMWF model for a given location in the Alps. These maps are available on meteociel.fr and wetterzentrale.de. I regularly get questions about how to interpret these maps, so it’s time for a background article about ensemble forecasts. I could give a whole series of articles on this interesting topic, but I’ll try to keep it short here and explain it (hopefully) as simply as possible.
In this article, I try to answer the following questions:
- What is an ensemble forecast?
- Why do we use an ensemble forecast?
- How is an ensemble forecast made?
- How can you interpret ensemble forecasts?
Deterministic chaos
We all know that long-term forecasts are often very uncertain. The uncertainty of a forecast increases with forecast time. Forecasts for 10 days ahead are a lot more uncertain than weather forecasts for 2 days ahead. I will now try to explain to you briefly why this is so.
The atmosphere is a deterministic system. This means that you can describe the system using complex physical laws, even though the parameters of these are such that the system behaves chaotically (sometimes more, sometimes less). This so-called deterministic chaos is characterised by a strong dependence on initial conditions. The chaotic characteristic of the atmosphere means that small differences in these initial conditions can lead to large differences in the weather forecast. This is because a weather model uses these initial conditions to calculate how the situation will change over the coming period. These errors in the initial conditions are amplified over the duration of these calculations.
Errors in initial conditions
Why is it that there are errors in the initial conditions of weather models? A weather forecast is made by first describing the current state of the atmosphere. This is done by the input of measurement data from weather stations, satellites, and information from aircraft, among others.
The more we know about the current state of the atmosphere through these measurements, the better the weather forecast will become. We observe a lot, but because the atmosphere is so complex, our weather forecast will never be completely perfect. For that, we would need to know every little detail about the current state of the atmosphere, which is simply not possible.
Ensemble forecasts as a solution
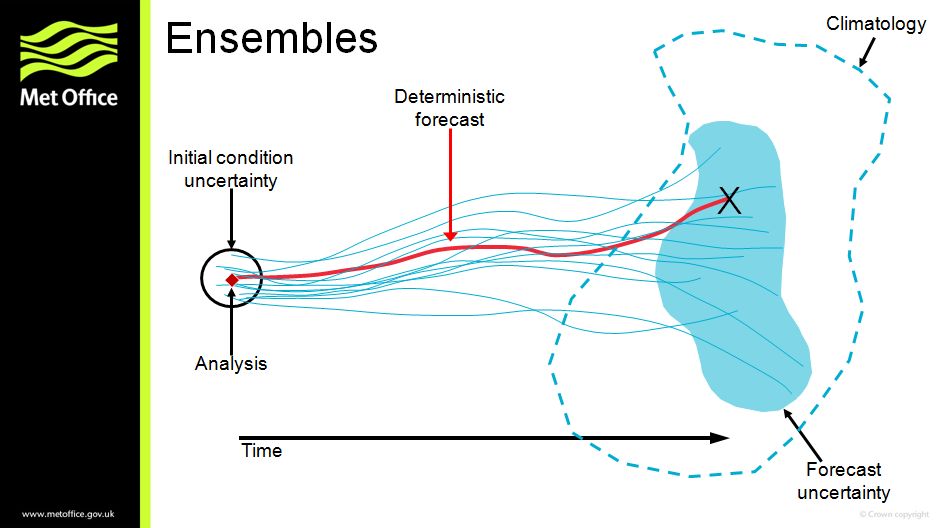
And this is where ensemble forecasts (also called plume forecasts) come to the rescue! With an ensemble forecast, you can visualise these uncertainties and estimate how large they are. How do we do that? Instead of one (deterministic numerical) forecast, you make an ensemble of several runs. You run the weather model several times in a row for a weather forecast. With each run, you change the initial conditions slightly. You can think of these runs, also called members, as possible scenarios. From such weather plumes you can derive probability forecasts.
Example of an ensemble
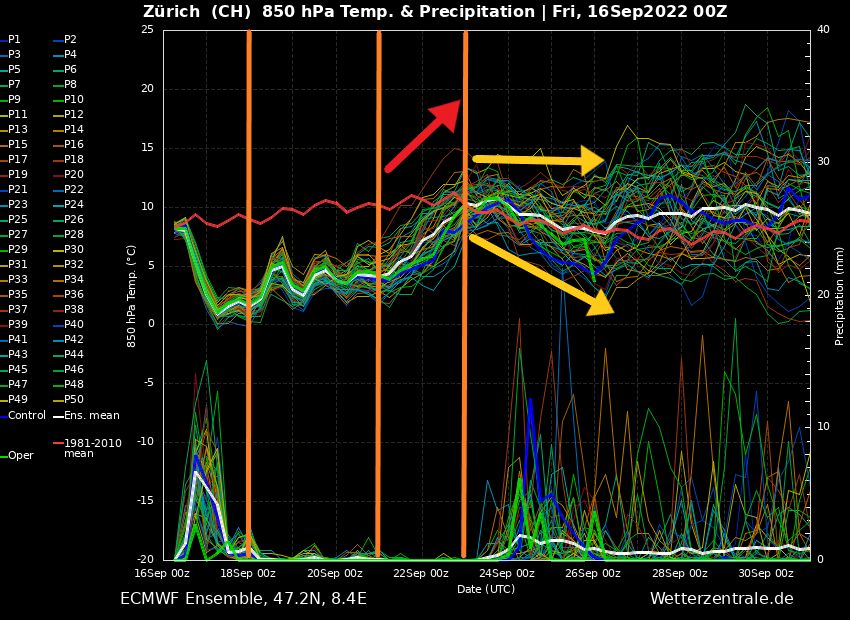
Above you can see as an example an ensemble of the European weather model (ECMWF) on wetterzentrale.de. In this case, it’s about the temperature at 850 hectopascal (about 1500 metres altitude) and the precipitation forecast. I often use this chart in my weather reports, but you can just as easily look at an ensemble forecast for other variables such as wind speed or air pressure. An ensemble forecast consists of:
- a main run (green)
- a control run (blue)
- 50 individual members
- the average of all members (bold white line)
- the climatological mean (bold red line)
The main run (also called the operational run) is the first forecast made at high resolution. Next, the same initial conditions are used with the control run, but at lower resolution. This is followed by the remaining simulations at low resolution where the initial conditions are slightly disturbed.
Interpreting ensemble forecasts
As you can see, an ensemble forecast gives us a range of possible values. An ensemble does not give an exact value for, say, the temperature for 10 days ahead, but it can detect a possible upcoming winter period in which we can expect a new PowderAlert. We can say something about the probability of certain weather events based on the clustering of multiple ensemble members, among other things.
The larger the spread, the more uncertain the forecast. The forecast for 18 September (two days ahead) shows a small spread for temperature. This means we can say with a high degree of certainty that we will see these temperatures. Going a step further and looking at 21 September, we see a clear trend of rising temperatures, but the spread has already increased a bit. So it is already a bit more uncertain to what extent we will face this rise in temperature. After 23 September (7 days ahead), the spread increases rapidly. Both the main run and the control run show a slight drop in temperature again, but we see more and more ensemble members opting for a scenario where we end up above the climatological average. The dispersion has increased considerably, so at the moment we cannot say for sure what will happen next.
Want to read more about weather?
Replies
Shouldn’t they be called spaghetti forecasts?
https://cdn.wepowder.com/weblog/2/30407.jpg?w=1024
; > )
Some products of ensembles are indeed called spaghetti plots :) With these plots of for example 500 hPa geopotential height or 850 hPa you can see some patterns (and decreasing predictability over time).
Current (all basically the same):
https://cdn.wepowder.com/site/forum/15/5b9b38d8d514e332ba533323a81a74bc_gfsspageu00_0_1.png?width=800\
6 days (still some patterns visible, but solutions start to diverge):
https://cdn.wepowder.com/site/forum/15/0a033ef157617e892ccc364e5f4ee20d_gfsspageu00_120_1.png?width=800\
By the end of next week no predictability:
https://cdn.wepowder.com/site/forum/15/e422b79a6d541b5df110fdb0588be469_gfsspageu00_300_1.png?width=800
Looks like divergent Kalman filters.
I’m planning on slicing through Graubunden, CH March 22-April 4, Davos, then SkiArena, then Engadin. Si j’espere le base décente.
The problem that I see with this models is that 90% of the time it is the “Warm” ensemble that wins the battle. Seldom it is below average,
All I see are warm ensembles. Where are the cold ones gone? I hope we get some cold periods from mid November. Otherwise we will ski on beautiful green pastures.